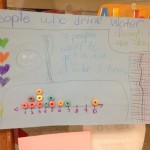
Fruit Loop Line Plots
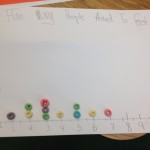
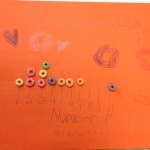
The students were given data (how many times a day students ask to get a drink of water) and, in pairs, created a line plot. Each fruit loop represented an “x” on the line plot.

Oak Grove Elementary
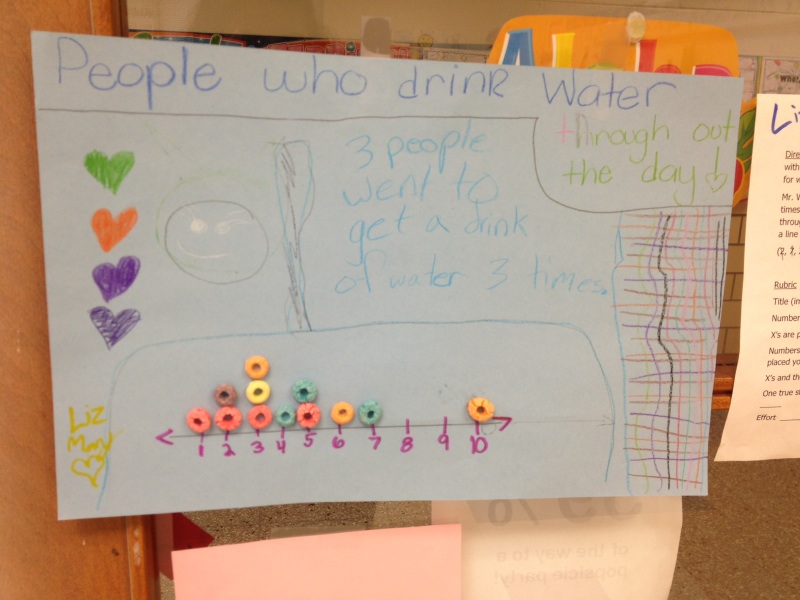
The students were given data (how many times a day students ask to get a drink of water) and, in pairs, created a line plot. Each fruit loop represented an “x” on the line plot.